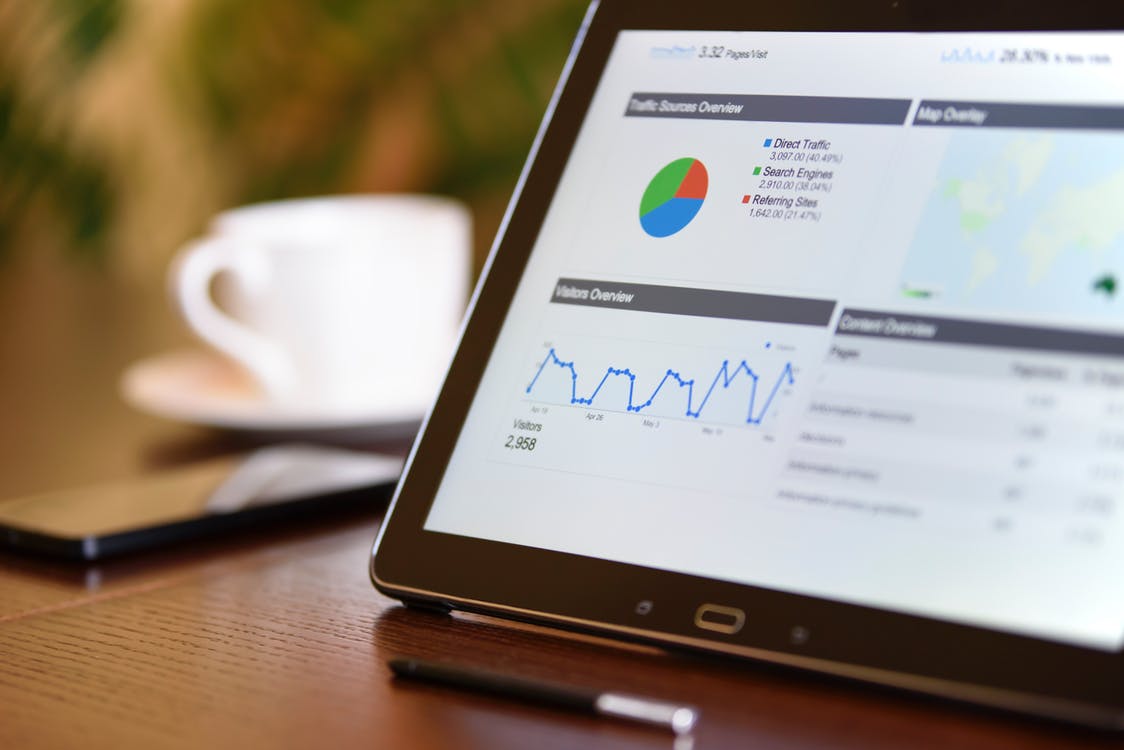
Google Analytics provides users with the ability to measure every aspect of a website, from unique visitors to referral sources, to bounce rates, device types, time on page, click through rates, and so much more. Knowing which reports to analyze can be difficult when you’re wading through so much data.
Good News! We did the research for you, and found some of the top Google Analytics reports to view based on current statistics gathered by industry experts.
1) MOBILE OVERVIEW REPORT
We live in a mobile world. The more mobile users that are visiting, and staying on your website, the better. Since Google first announced its plan to roll out mobile-first indexing in late 2016, the importance of having a mobile-friendly site has become increasingly important.

If your mobile visitor numbers are growing, it’s a good sign that your website is healthy and will likely rank well in Google Search.
2) AUDIENCE BEHAVIOR REPORT – NEW VS. RETURNING
An increase in new visitors to your site is a great sign. It means you’re generating interest in your business, and expanding your brand reach. An increase in returning visitors may be an even better sign of the health of your website, as it means that users are interested enough in the products and services you’re offering to come back again.
Why is this significant? Returning visitors are more engaged in your content, and they’re more likely to take an action such as fill out a form or make a purchase than a new visitor.
3) LANDING PAGES REPORT – BOUNCE RATE
It’s important to know which pages people are visiting and spending time on versus pages where they land and immediately leave. It’s best to view your top landing pages and analyze which ones are contributing to your website’s high bounce rate. Once you identify the pages that are causing users to leave, focus on fixing those pages to keep users more engaged on that page such as adding more targeted content, images and a call to action.
4) ALL TRAFFIC CHANNELS REPORT
It’s important to know what channels are producing traffic to your website. When looking at a specific date range for this report, be sure to compare to the previous year to see how your traffic compares to the same dates last year. This way you can see website improvements over a particular time.

This report is especially important if traffic is down since it will help you see what channels have changed.
5) CONVERSION GOALS OVERVIEW REPORT
One of the most important measurements to track daily, weekly and monthly is the number of goal completions. The Goals report in Google Analytics tracks specific interactions you set up such as form submissions or downloads. While you are most likely tracking these conversions in another tool, it is in Google Analytics where you can compare these metrics to the overall traffic on your site.
While these are some of the top Google Analytics reports to watch, they are certainly not the ones you should be paying attention to. Which metrics and dimension you focus on most will depend upon the type of site you have, and your goals for the short and long term.
CommonPlaces can help you identify the right metrics, reports and dimensions to analyze, and work with you to implement strategic marketing objectives to reach your website goals. Visit our digital marketing and web development services page and contact us to set up a free consultation.


